Mathematics is often used to analyze information, identify patterns, and make decisions based on data. Whether studying test scores, business profits, scientific measurements, or sports statistics, data helps us understand the world around us. However, not every value in a data set behaves the same way. Sometimes a number appears that is significantly different from the rest of the values. In mathematics and statistics, this unusual value is known as an outlier.
Understanding outliers is important because they can influence calculations, affect averages, and sometimes reveal important information about a data set. Students, researchers, business analysts, and scientists frequently encounter outliers when working with data. Knowing how to identify and interpret them is a fundamental skill in mathematics and statistics.
This article explains what an outlier in math is, why outliers occur, how to identify them, and why they are important when analyzing data.
Definition of an Outlier in Math
An outlier is a data value that differs significantly from the other values in a data set. It appears unusually high or unusually low compared to the rest of the numbers.
For example, consider the following set of numbers:
5, 6, 7, 8, 9, 50
In this data set, the number 50 is much larger than the other values. Since it is far away from the general pattern of the data, it is considered an outlier.
Outliers can occur in many different types of data. They may appear in exam scores, temperatures, salaries, population figures, scientific experiments, and countless other situations where numbers are collected and analyzed.
Why Do Outliers Occur?
Outliers can appear for several reasons. Sometimes they result from mistakes, while other times they represent genuine observations.
One common cause is data entry errors. For example, if a student’s test score is entered as 950 instead of 95, the incorrect value becomes an outlier.
Measurement errors can also create outliers. A faulty thermometer, broken sensor, or malfunctioning instrument may record values that differ significantly from the actual measurements.
However, not all outliers are errors. Some outliers represent real events or unusual circumstances. For instance, if most employees earn between $30,000 and $80,000 annually, but the company’s CEO earns $2 million, that salary may appear as an outlier even though it is accurate.
Understanding why an outlier exists is an important step before deciding whether it should be included or excluded from analysis.
Examples of Outliers in Everyday Life
Outliers are common in everyday situations. Consider a classroom where most students score between 70 and 90 on a test, but one student scores 25. That score may be considered an outlier because it is significantly lower than the rest.
In sports, a player who scores an unusually high number of points compared to teammates may create an outlier within performance statistics.
Weather data also contains outliers. If a city normally experiences temperatures between 15°C and 35°C but suddenly records a temperature of 48°C, that reading may be considered an outlier.
Business data frequently includes outliers as well. A company might experience one month with exceptionally high sales due to a special event or promotion, creating a value that stands apart from typical monthly performance.
How Outliers Affect Data
Outliers can have a significant impact on statistical calculations. One of the most noticeable effects is on the mean, commonly known as the average.
Consider the following numbers:
10, 12, 14, 16, 18
The mean is:
(10 + 12 + 14 + 16 + 18) ÷ 5 = 14
Now add an outlier:
10, 12, 14, 16, 18, 100
The new mean becomes:
(10 + 12 + 14 + 16 + 18 + 100) ÷ 6 = 28.3
The average increases dramatically because of the outlier.
This example demonstrates why outliers are important. A single unusual value can change the interpretation of an entire data set.
Methods for Identifying Outliers
Mathematicians and statisticians use several techniques to identify outliers. Some methods involve visual inspection, while others use mathematical formulas.
One simple approach is to look at the data and identify values that appear far away from the rest. While this method can work for small data sets, larger collections often require more precise techniques.
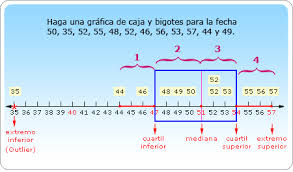
Graphs such as box plots are commonly used to visualize outliers. A box plot displays the distribution of data and highlights values that fall outside the expected range.
Statistical calculations provide another reliable way to identify outliers. These methods help determine whether a value is unusually distant from the majority of the data.
Understanding the Interquartile Range (IQR)
One of the most popular methods for identifying outliers is the Interquartile Range, commonly known as the IQR method.
The IQR measures the spread of the middle 50% of the data. It is calculated by finding the difference between the third quartile (Q3) and the first quartile (Q1).
The formula is:
IQR = Q3 − Q1
After calculating the IQR, outliers are identified using the following rules:
Lower Boundary = Q1 − 1.5 × IQR
Upper Boundary = Q3 + 1.5 × IQR
Any value below the lower boundary or above the upper boundary is considered an outlier.
This method is widely used because it provides a consistent and objective way to identify unusual values.
Outliers and Data Analysis
Outliers play an important role in data analysis because they can influence conclusions and decision-making.
Researchers often examine outliers carefully before proceeding with analysis. Removing an outlier without understanding its cause can result in inaccurate conclusions. On the other hand, including an incorrect value can distort results.
For example, medical researchers studying patient health data may investigate outliers to determine whether they represent errors or important medical conditions.
Business analysts may use outliers to identify unusual customer behavior, unexpected market trends, or opportunities for growth.
Rather than viewing outliers as problems, analysts often treat them as valuable clues that provide additional insight into the data.
Advantages of Studying Outliers
Studying outliers can reveal important information that might otherwise go unnoticed.
Outliers can help identify errors in data collection and improve overall data quality. Detecting mistakes early prevents inaccurate conclusions and poor decision-making.
They can also reveal rare events or exceptional circumstances. In scientific research, unusual observations sometimes lead to major discoveries.
Businesses use outliers to identify high-performing products, exceptional customers, or unusual market behavior. These insights can support strategic planning and innovation.
In education, teachers may use outlier analysis to identify students who need additional support or students who demonstrate exceptional performance.
Challenges of Working with Outliers
Although outliers provide valuable information, they can also create challenges.
One difficulty is determining whether an outlier is a genuine observation or a mistake. This often requires additional investigation and context.
Outliers can complicate statistical analysis because they may violate assumptions used in certain mathematical models. Analysts must sometimes use specialized techniques to minimize their impact.
Additionally, different methods of identifying outliers may produce different results. A value classified as an outlier under one method may not be considered unusual under another approach.
These challenges highlight the importance of careful analysis and informed decision-making when working with data.
Real-World Applications of Outliers
Outliers are used in many fields beyond mathematics classrooms.
In finance, analysts monitor unusual stock price movements that may indicate important market events.
In cybersecurity, outliers can help identify suspicious activities and potential security threats.
In healthcare, unusual patient measurements may signal medical conditions requiring further examination.
In manufacturing, outliers may indicate equipment malfunctions or quality control issues.
The ability to recognize and interpret outliers is valuable across numerous industries and professions.
Conclusion
An outlier in math is a value that differs significantly from the other numbers in a data set. These unusual values can appear because of errors, unique events, or natural variations within the data. While outliers may sometimes seem like exceptions, they often provide important insights that help researchers, businesses, and students better understand information.
Learning how to identify outliers using methods such as visual inspection and the Interquartile Range helps improve data analysis accuracy. Outliers can influence averages, affect statistical calculations, and reveal meaningful patterns that might otherwise remain hidden.
Whether studying mathematics, conducting research, analyzing business performance, or exploring scientific data, understanding outliers is an essential skill. By recognizing their impact and interpreting them correctly, we can make better decisions and gain deeper insights from the data we encounter every day.